

Spark New Zealand
Digital Interactive Bill
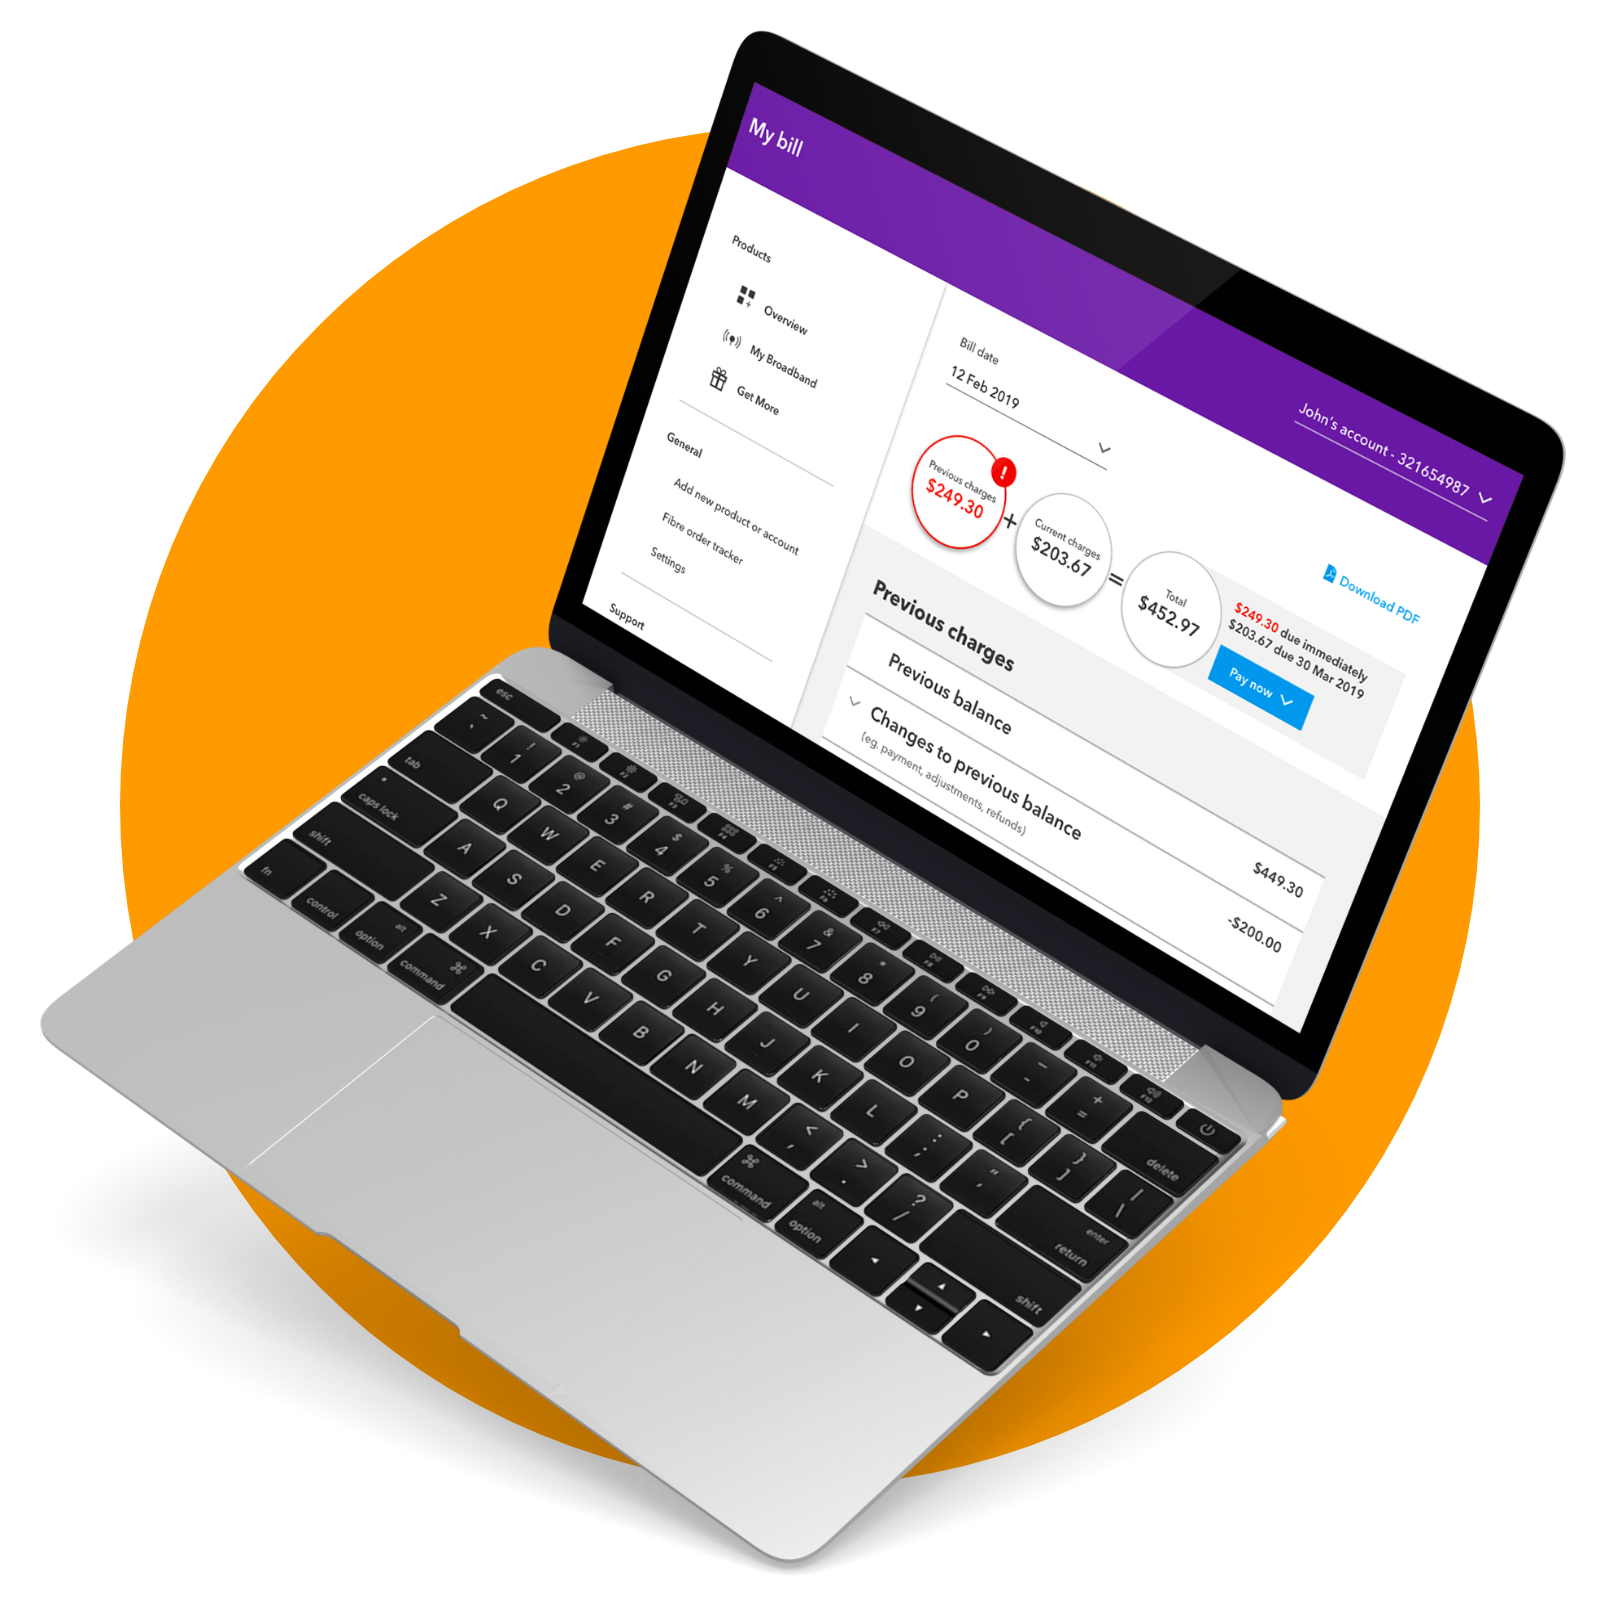
Spark customers have received a bill in either paper or PDF format. If they wanted to take action, they needed to contact us or navigate themselves to the relevant online journey.
The new digital interactive bill is an innovative new way for customers to receive, interact with and pay their bill. I was involved in researching and designing the digital interactive bill.
Problems we're trying to solve
• Too many billing queries to the contact centre – billing queries drive over 20% of all contacts to the call centre.
• Customers had to download PDFs to view their bill details, which can be frustrating and time-consuming.
• Customers had to download PDFs to view their bill details, which can be frustrating and time-consuming.
• Customers can't take action directly from their bill or self-serve online.
• No flexibility in how we present and explain charges on the bill.
• No flexibility in how we present and explain charges on the bill.

Key tasks
1. Research
2. How would we measure our success
3. User experience flow diagrams
4. Wireframe designs
5. Detailed designs
2. How would we measure our success
3. User experience flow diagrams
4. Wireframe designs
5. Detailed designs
6. Documentation
7. Supporting developers
7. Supporting developers

Research
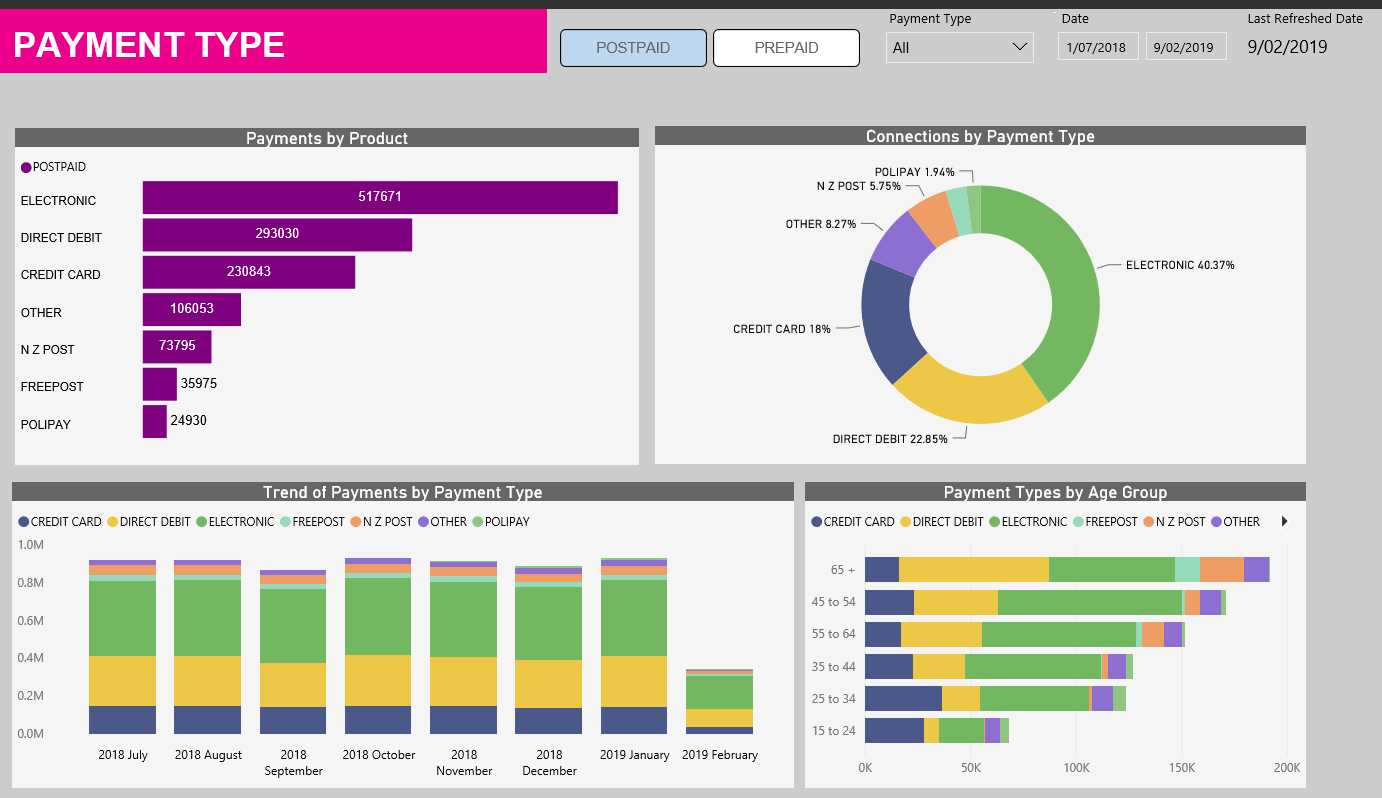
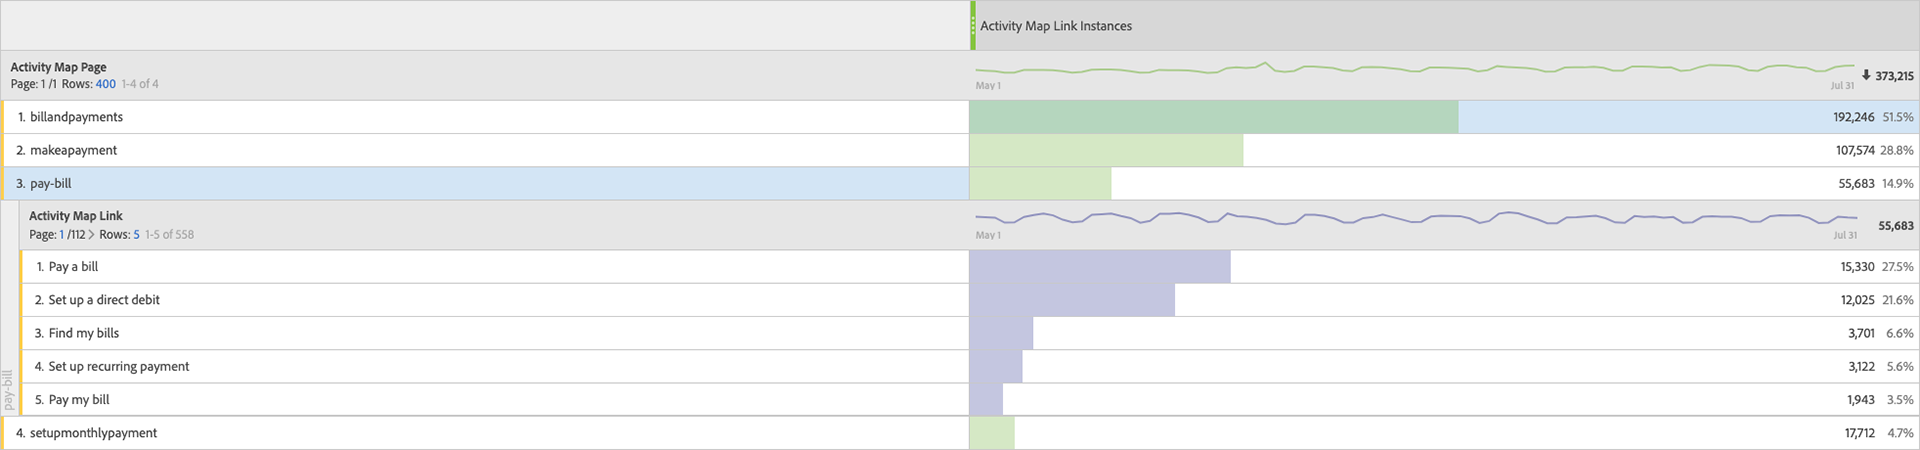
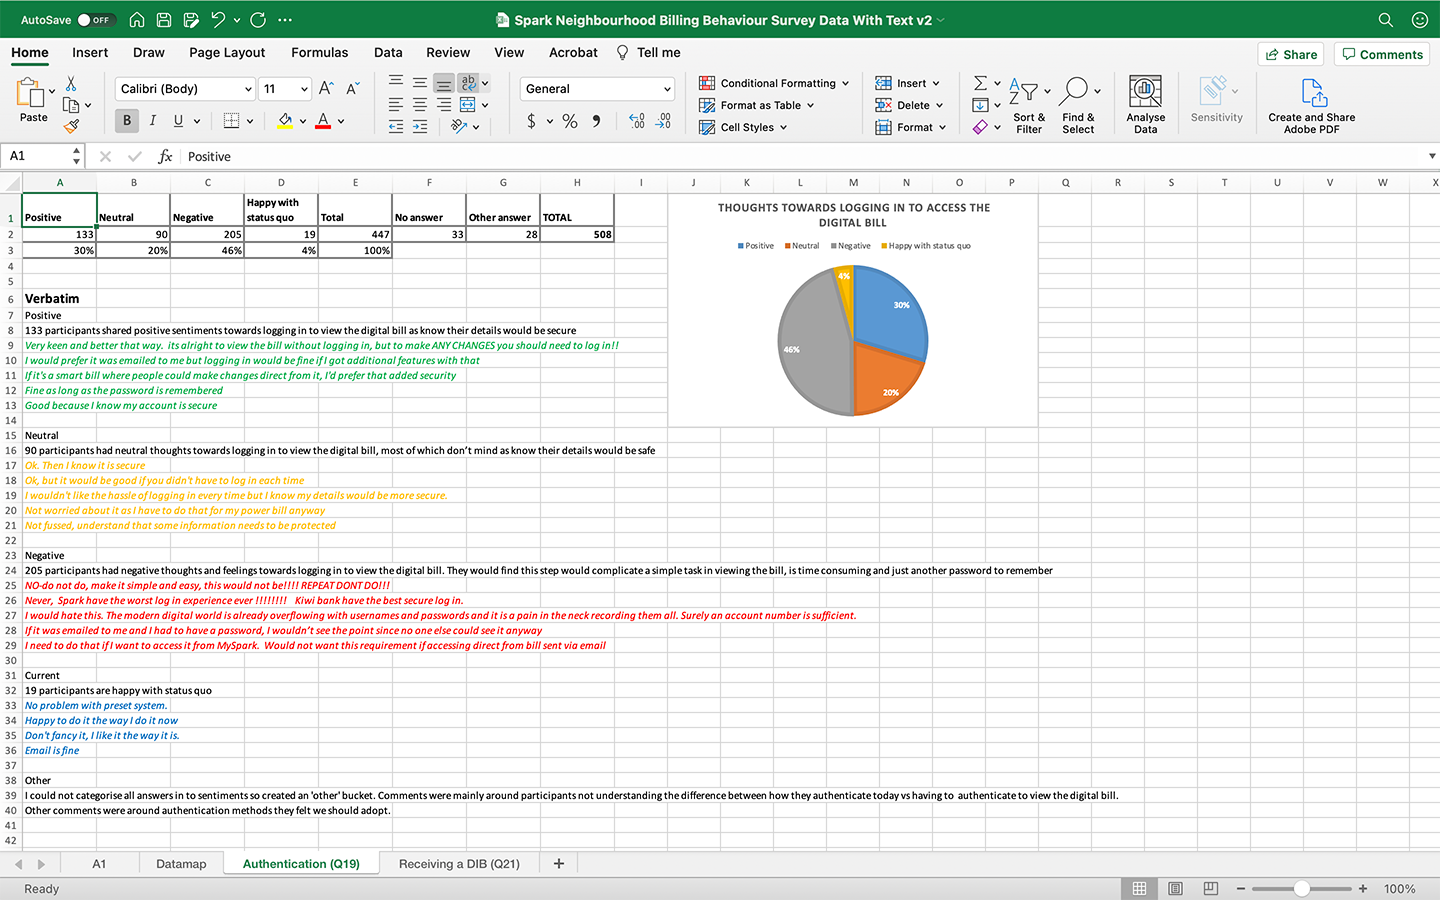
We conducted user interviews, used data analytics and a customer survey to understand our customers. By researching, we can design the digital interactive bill to solve our customer’s problems and understanding what they need.
We conducted the user interviews by telephone calls to our customers, used Adobe Analytics to look at our data, and Spark Neighbourhood for the customer survey.
How would we measure our success
Our squad got together to plan and define how we would measure our success, and used the following metrics:
• A reduction in billing queries to the contact centre
• An increase in subsequent billing journeys being completed digitally
• Voice of the customer score for ‘the bill is easy to understand’
• A reduction in billing queries to the contact centre
• An increase in subsequent billing journeys being completed digitally
• Voice of the customer score for ‘the bill is easy to understand’
We decided to launch the Digital Interactive Bill to a small group of customers, get their feedback and gradually roll it out to everybody. We can iterate, improve and enhance features.
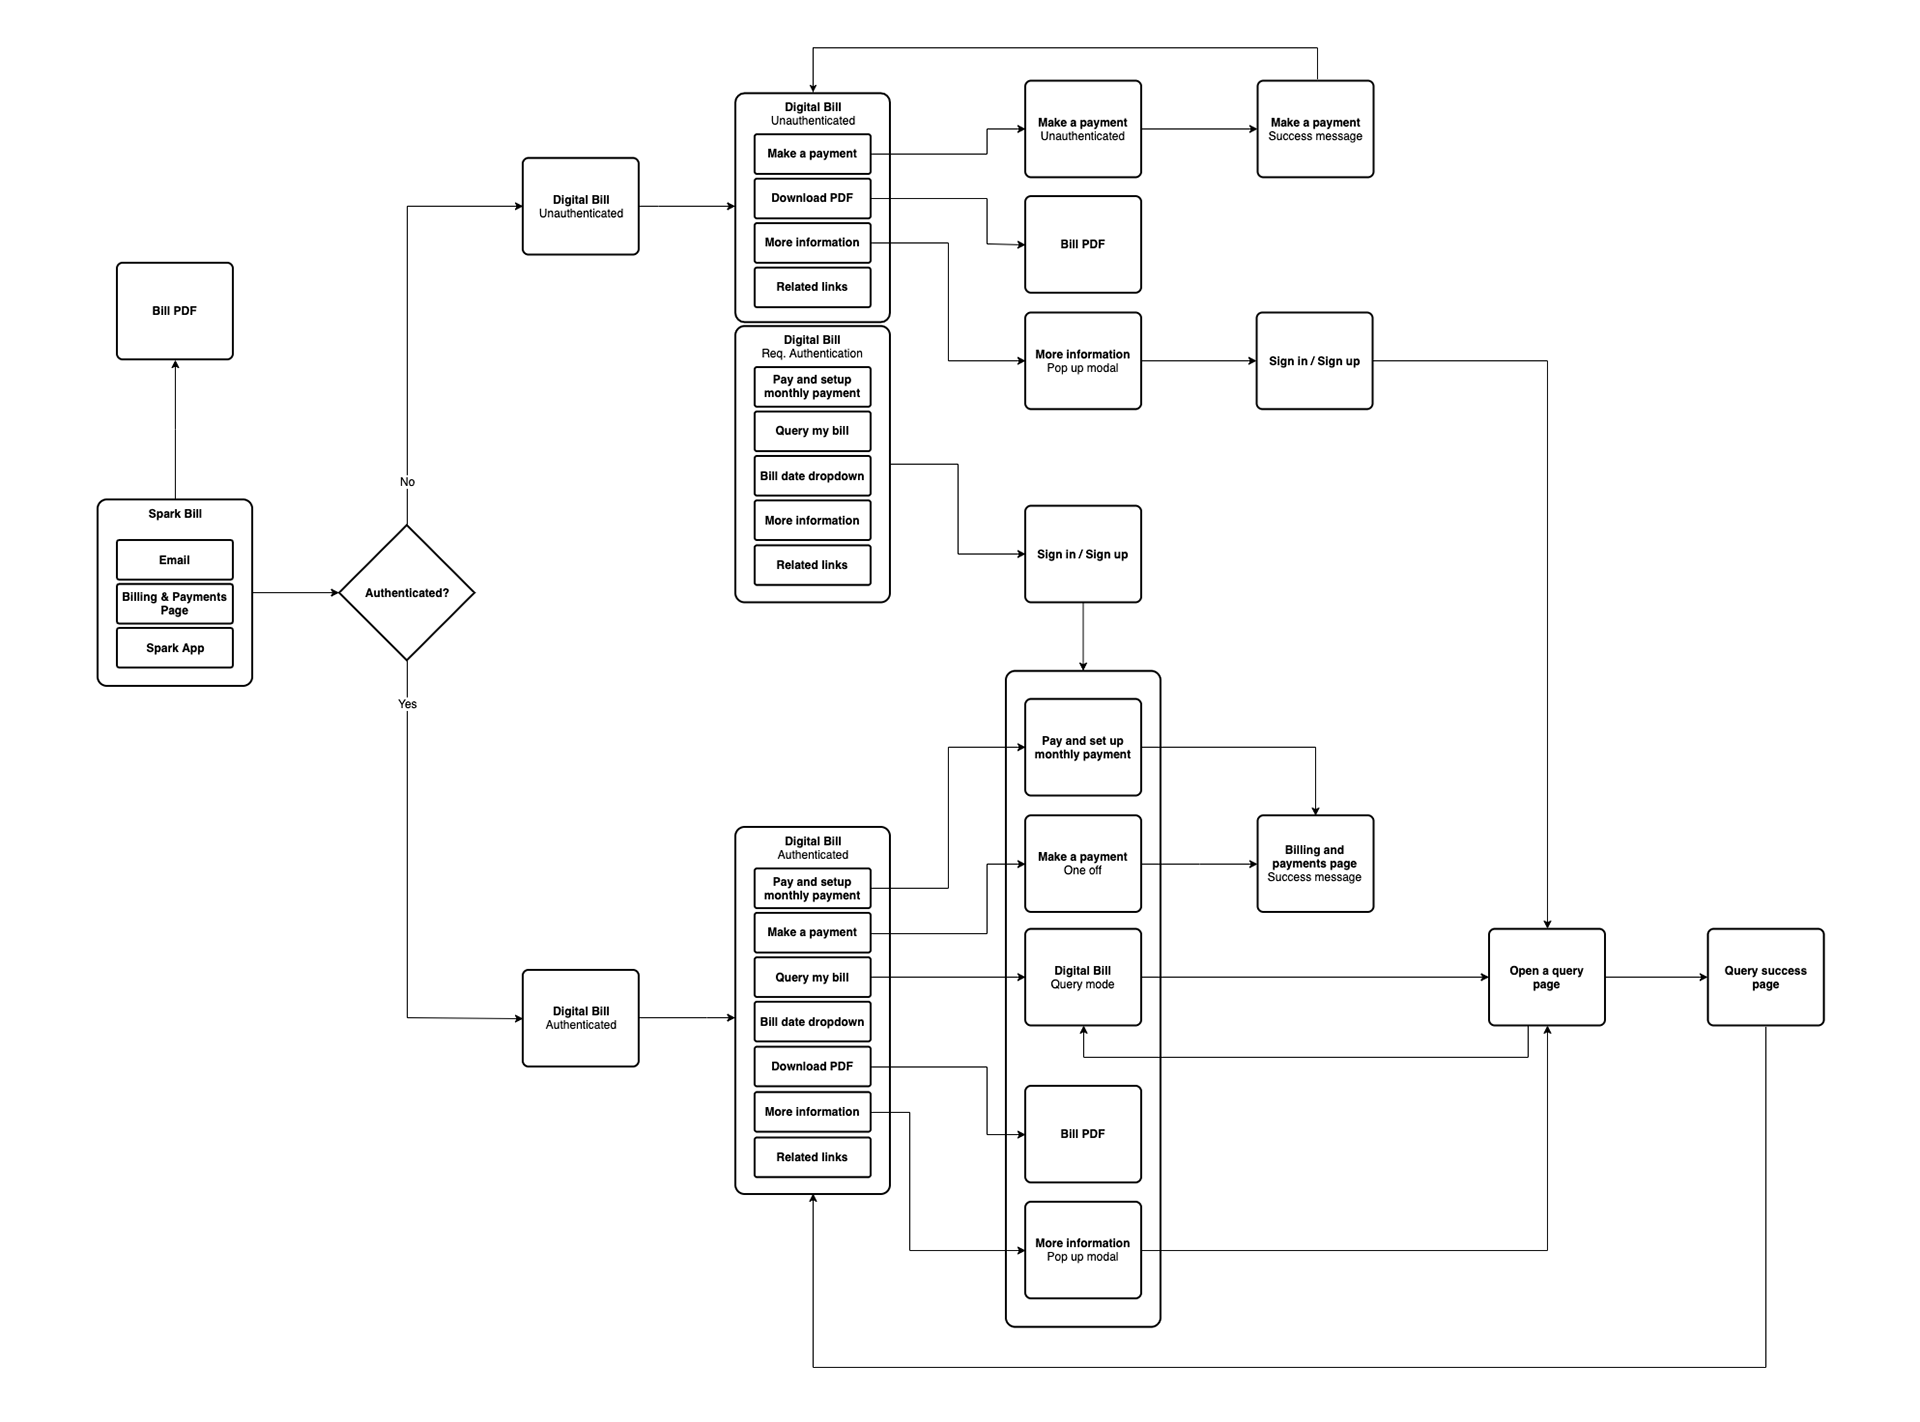
User experience flow diagram
I mapped out the user experience flow diagram for the digital interactive bill and the Query a bill user journey. Mapping out the flow diagram will give us a picture of the whole experience and see how everything is connected.
Wireframe designs
Using the flow diagram created and existing elements from the current bill, I mocked up wireframes and created the prototype of the digital interactive bill. Sharing and presenting to the Spark design team and key stakeholders for feedback and iterate on the designs.
I used Sketch App and Abstract applications to design the wireframes.
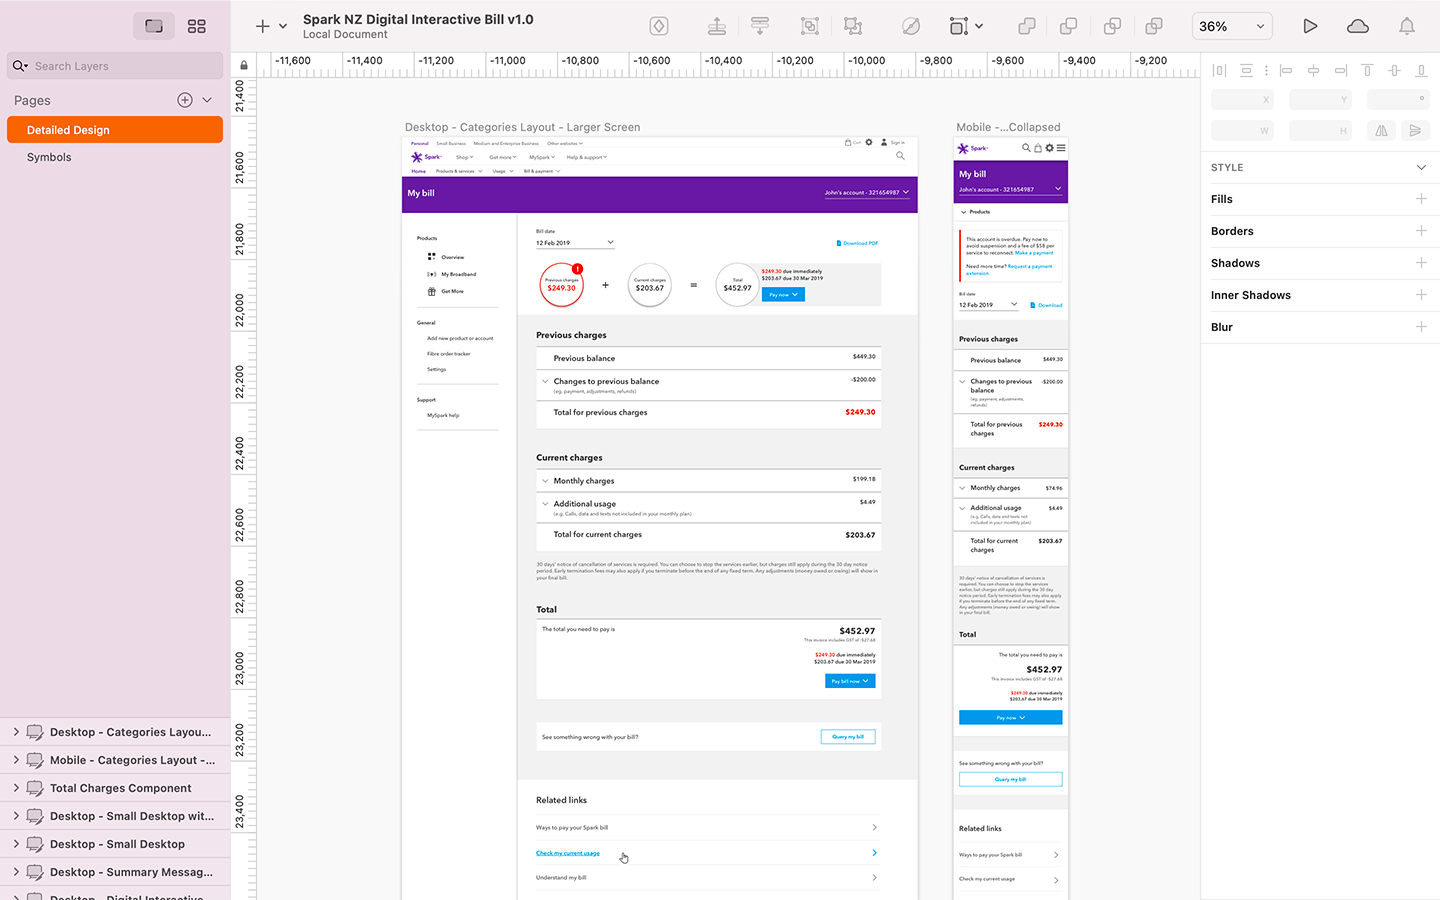
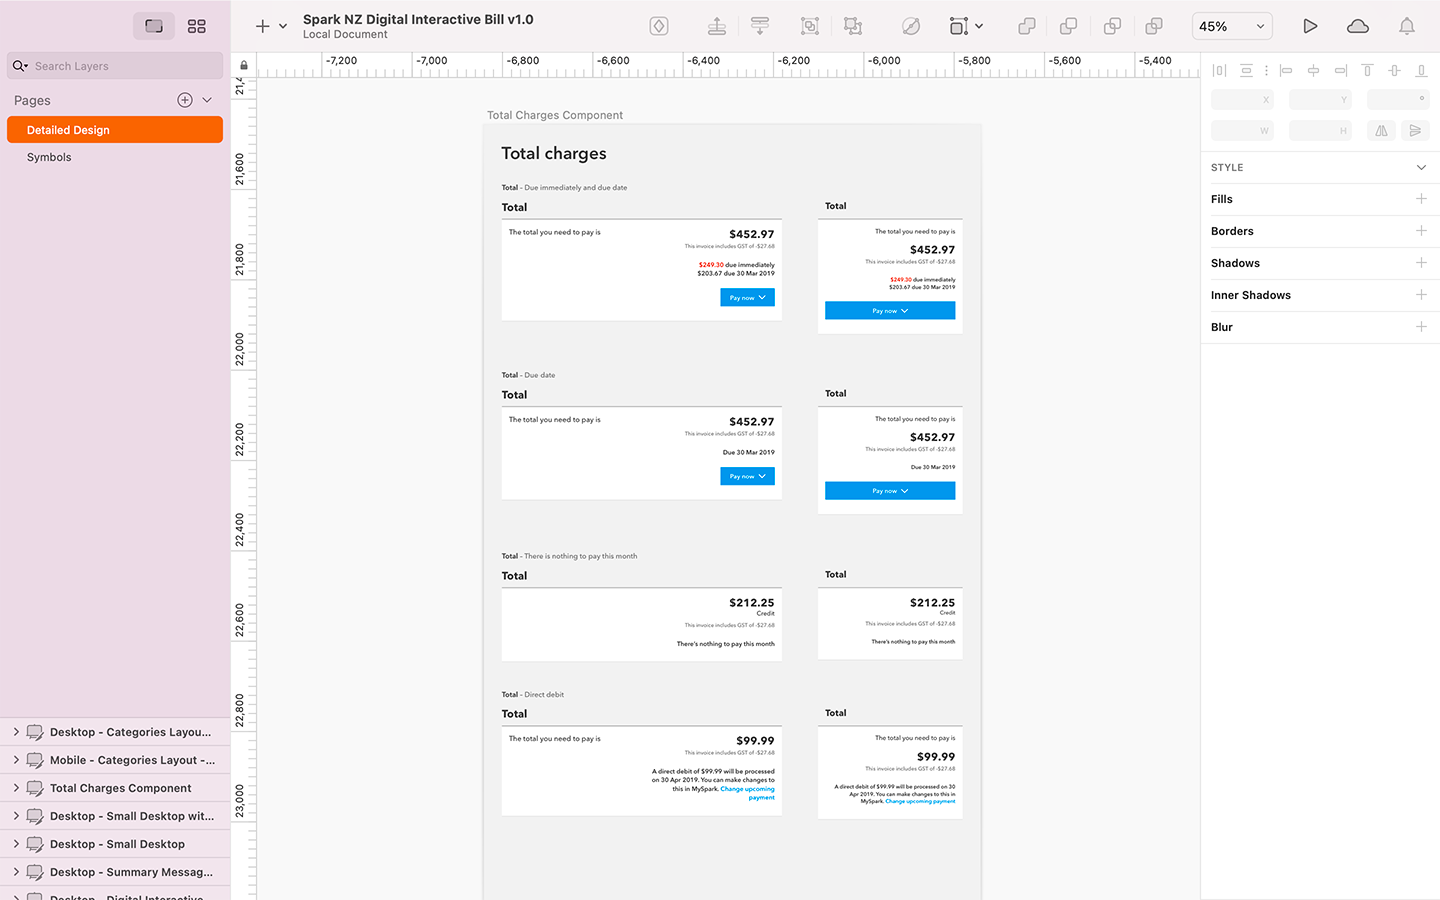
Detailed designs
After creating the wireframes and prototype, I used the wireframes to create detailed designs for desktop, mobile, tablet and presented them to our squad.
During the Billing Tribe showcase, the Billing and Payments Squad presented the digital interactive bill, and I talked about the research and designs.
Documentation
Our squad documented the information of the Digital Interactive Bill in our Microsoft Azure Wiki Page.
Supporting the developers
I supported the Front-end developer and Quality assurance tester whenever they had queries about the designs.

Spark New Zealand – October 2019
Digital Interactive Bill
User experience and user interface design for desktop and mobile responsive website