

Waka Kotahi NZ Transport Agency
Traffic Watcher Analytics
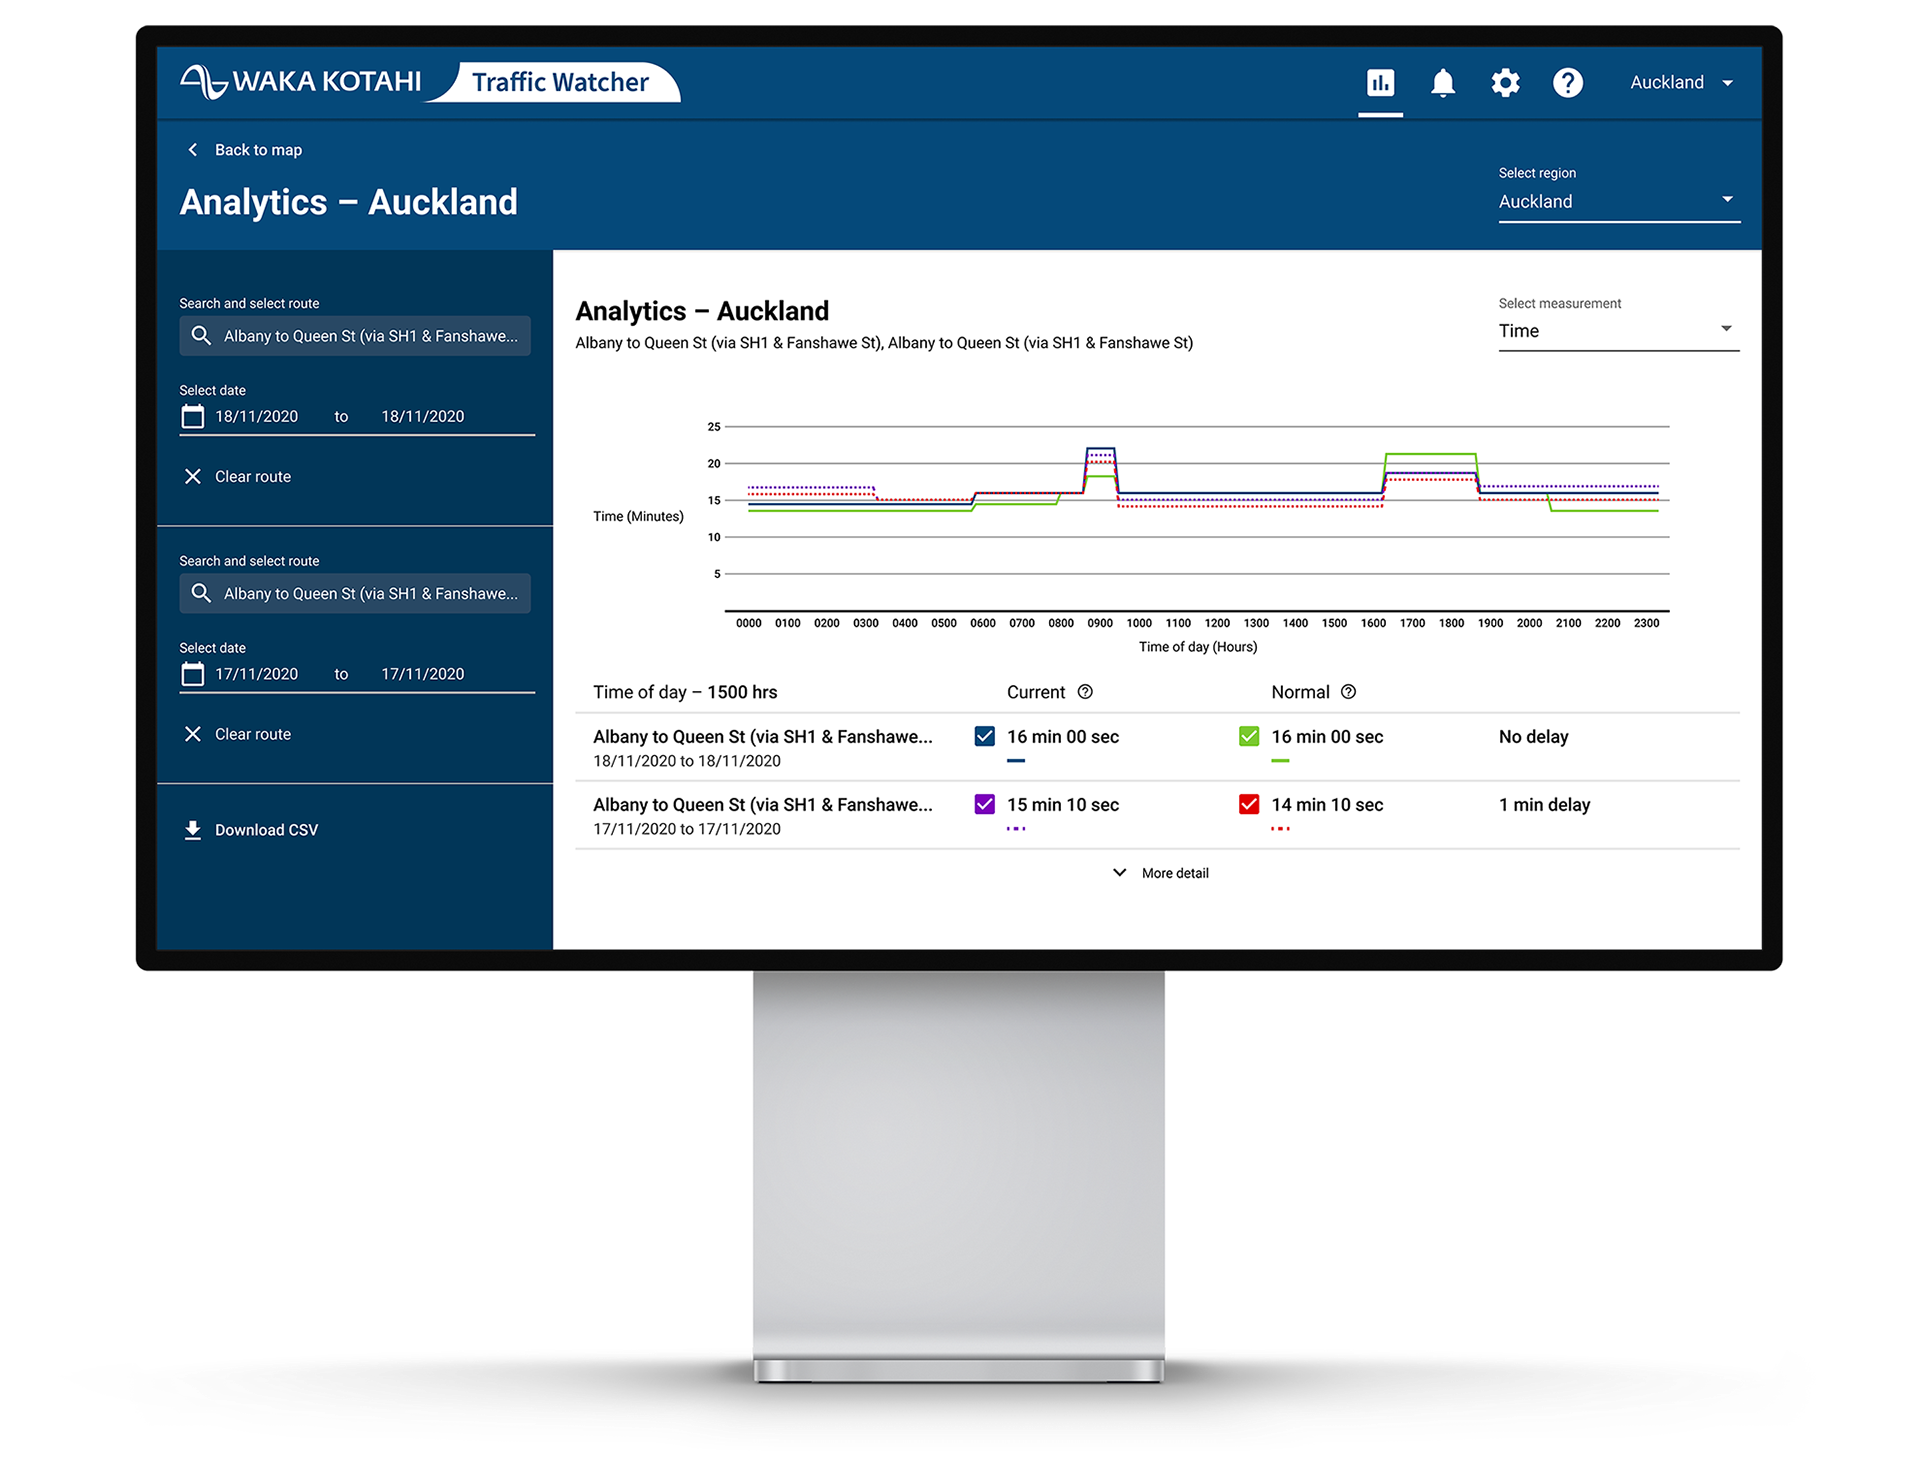
Traffic Watcher is a web application that uses Google data to monitor the transport network. It constantly checks the current travel time to normal and notifies the end-user about when there’s an abnormal delay in the network as-it-happens.
It is used at a national-level by the Transport Operation Centres, Journey Managers and City Councils, and I was involved in researching and designing the analytics page.
Problems we're trying to solve
• Data was hard to understand because there wasn’t any data visualisation
• Users didn’t have evidence for traffic management reporting
• Users didn’t know when the best time to act on traffic management was
• Users didn’t know which alternative route is the most efficient to divert the traffic to
• Users didn’t have evidence for traffic management reporting
• Users didn’t know when the best time to act on traffic management was
• Users didn’t know which alternative route is the most efficient to divert the traffic to

Key tasks
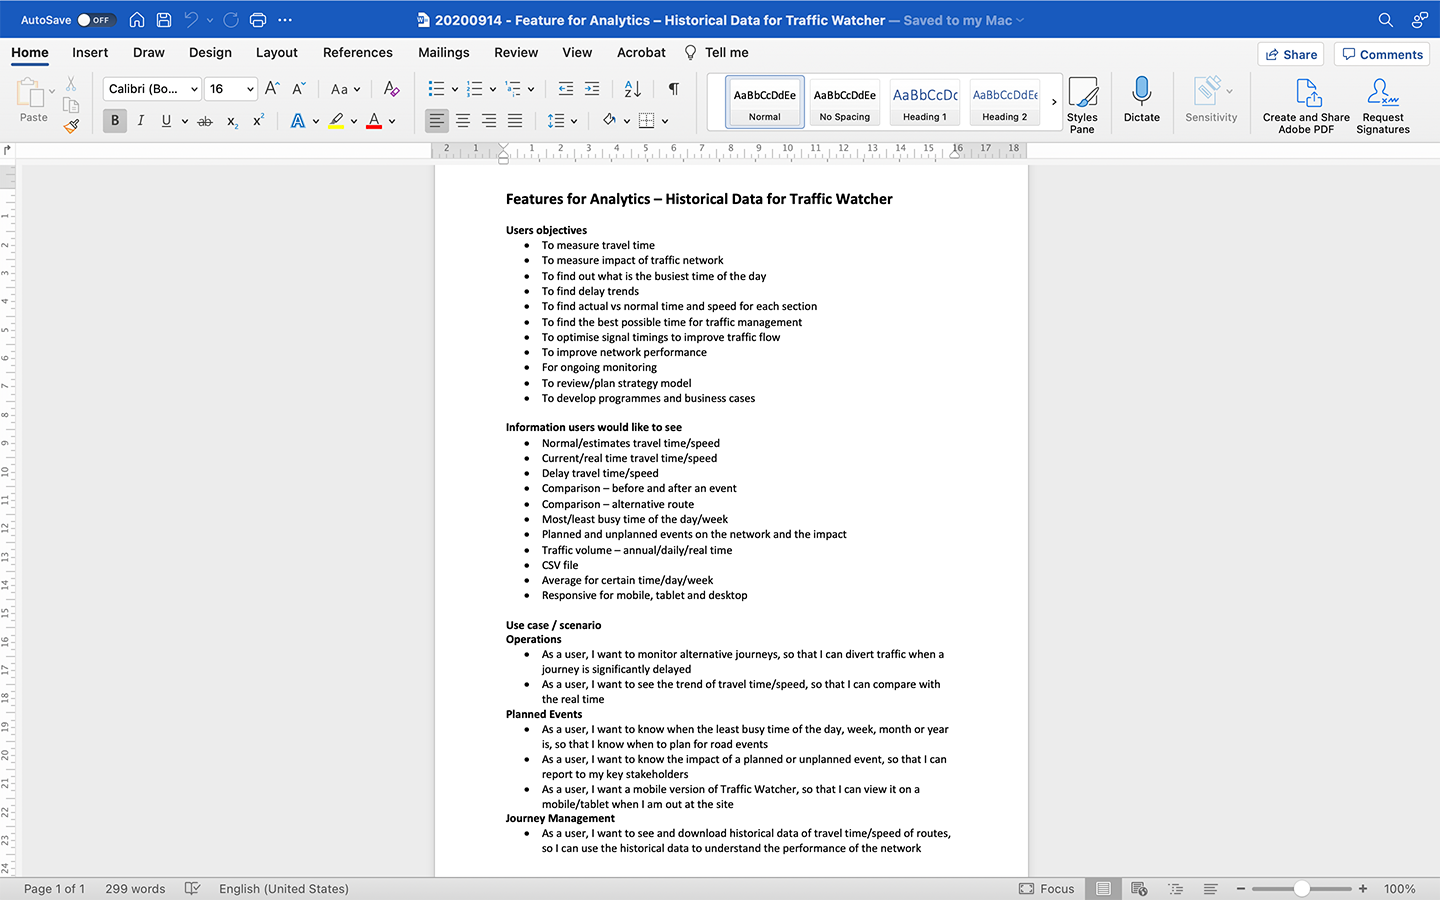
1. Conduct user interviews and gather requirements
2. Co-designing and ideation with the UX/UI team
3. Wireframing and prototyping
4. Usability testing
5. Detailed design
6. Creating tickets in JIRA
7. Supporting developers
8. Designing help and support materials
2. Co-designing and ideation with the UX/UI team
3. Wireframing and prototyping
4. Usability testing
5. Detailed design
6. Creating tickets in JIRA
7. Supporting developers
8. Designing help and support materials

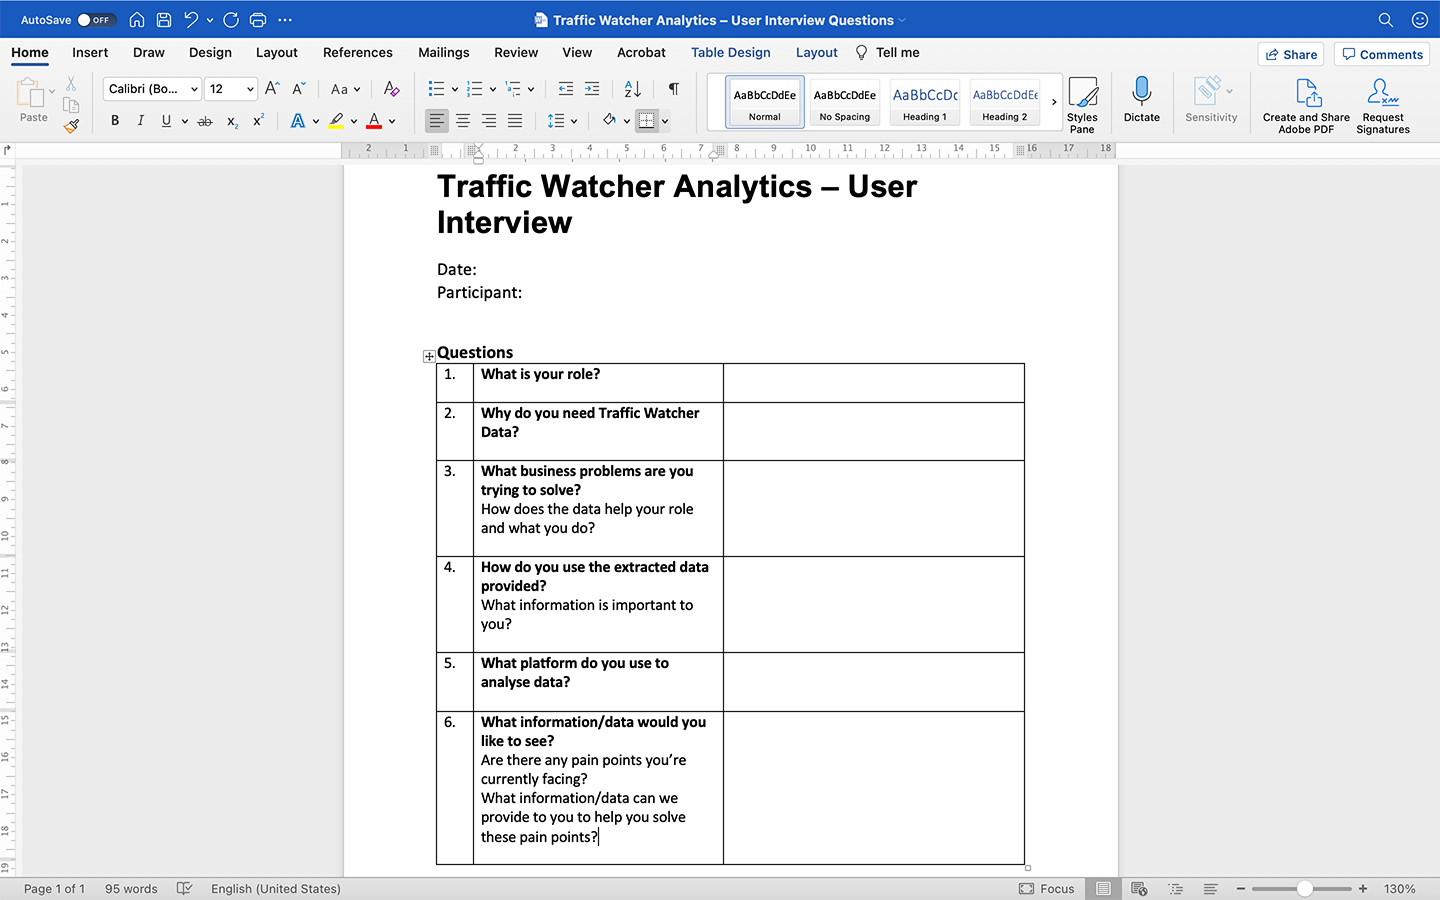
Conduct user interviews and gather requirements
I conducted user interviews with 12 participants to understand what they need and gathered requirements for the analytics page. The participants included Journey managers, Traffic signal engineers, Traffic network managers, Transport advisors and Transport planners.
I wanted to make sure that we designed the analytics page that the users will use and help them in their role.
Co-designing and ideation with the UX/UI team
I set up a co-design and ideation session with Waka Kotahi’s UX/UI design team to ideate as many concepts as possible and defining the best concepts to validate for usability testing.
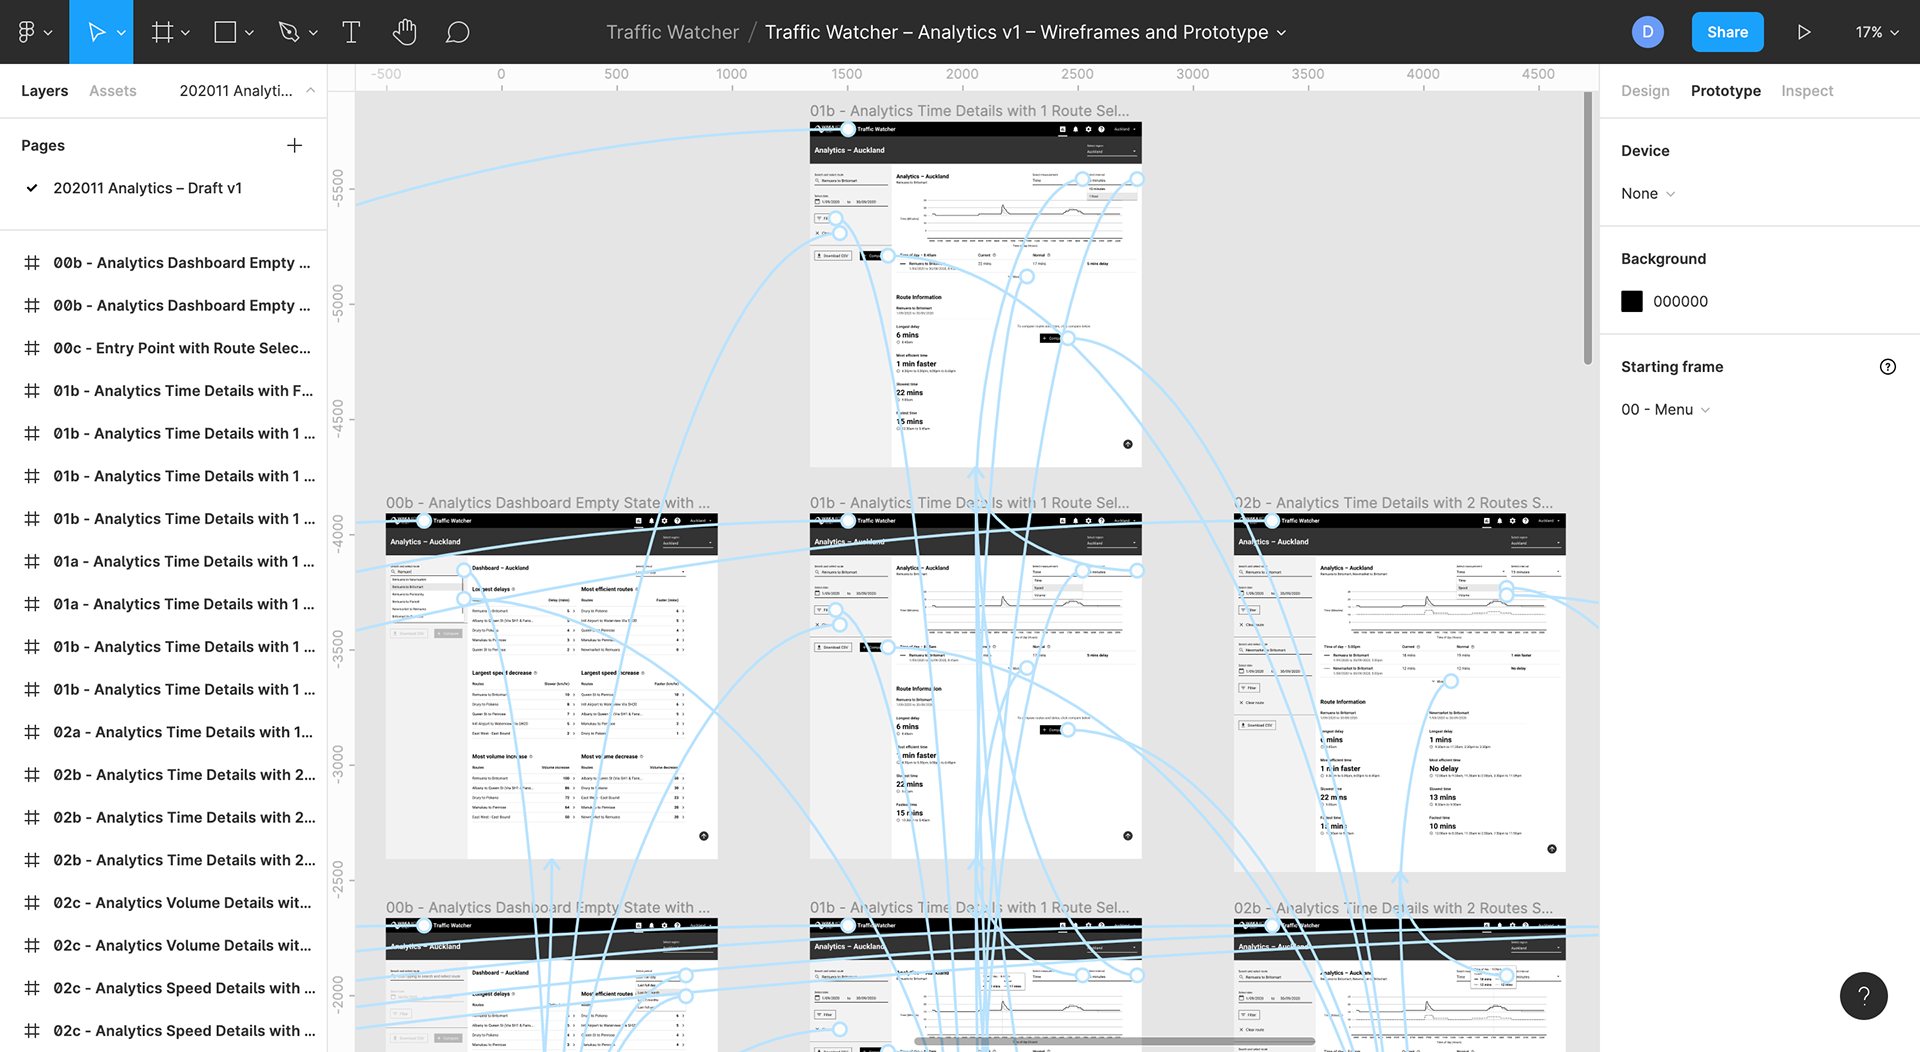
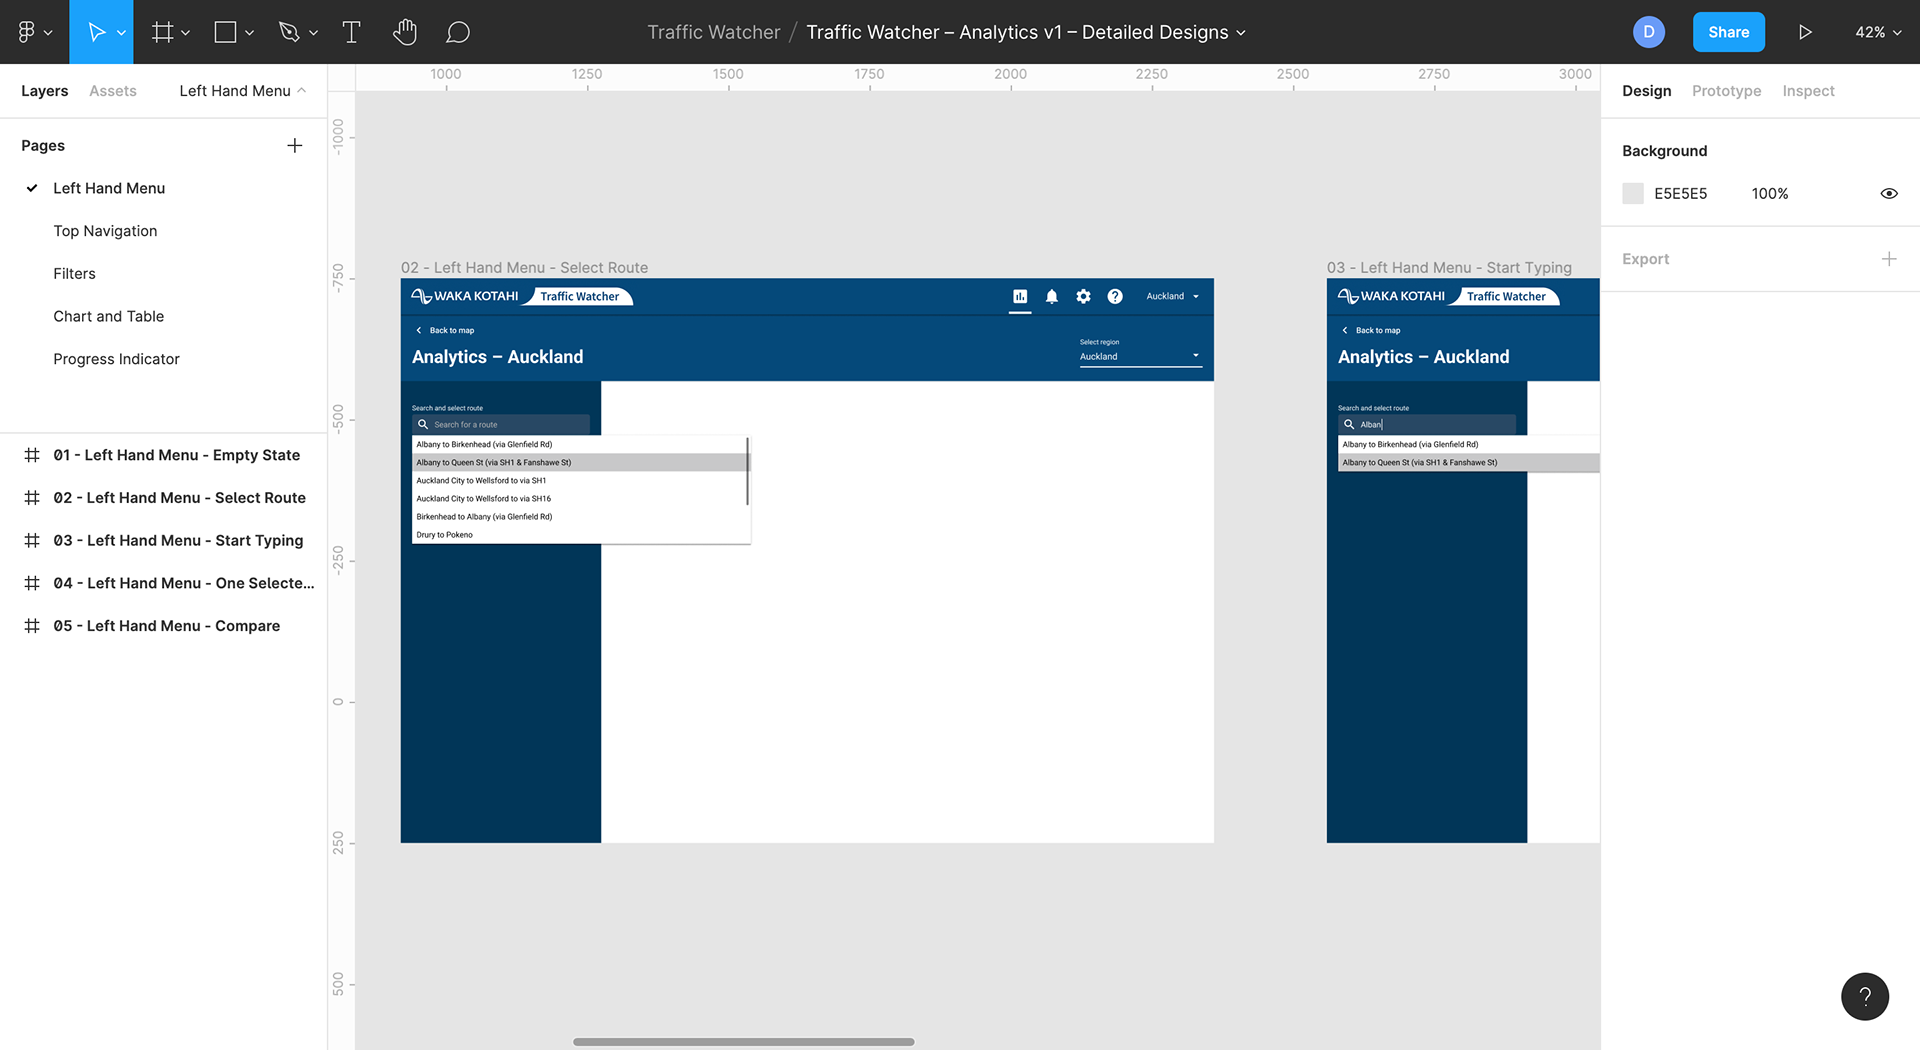
Wireframing and prototyping
Using the ideas from the co-design sessions, I used the Figma application to design wireframes and the prototype for usability testing.

Usability testing
I facilitated usability testing with 6 participants, broken down into Transport planners, Traffic engineers and Journey managers using Lookback and MS Teams applications.
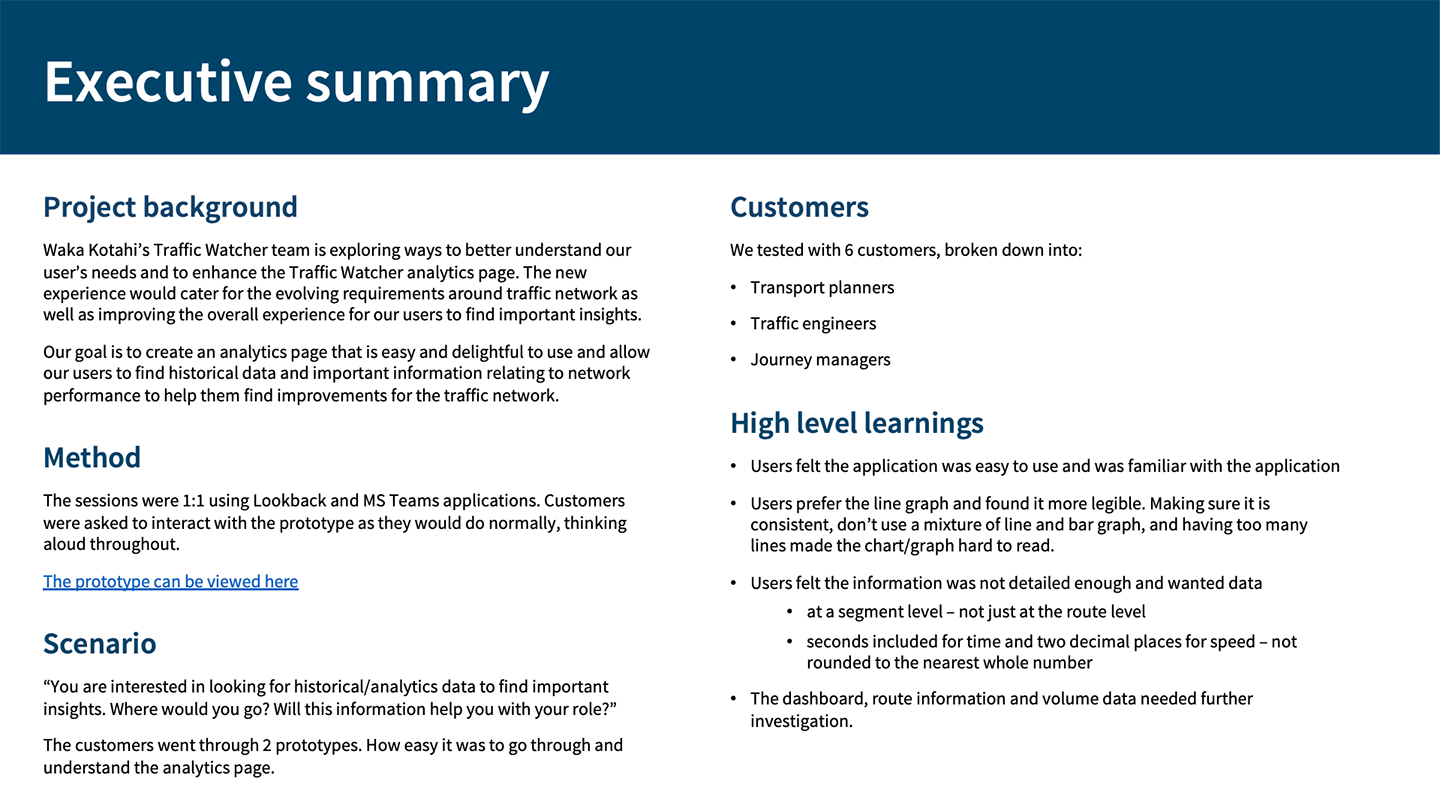
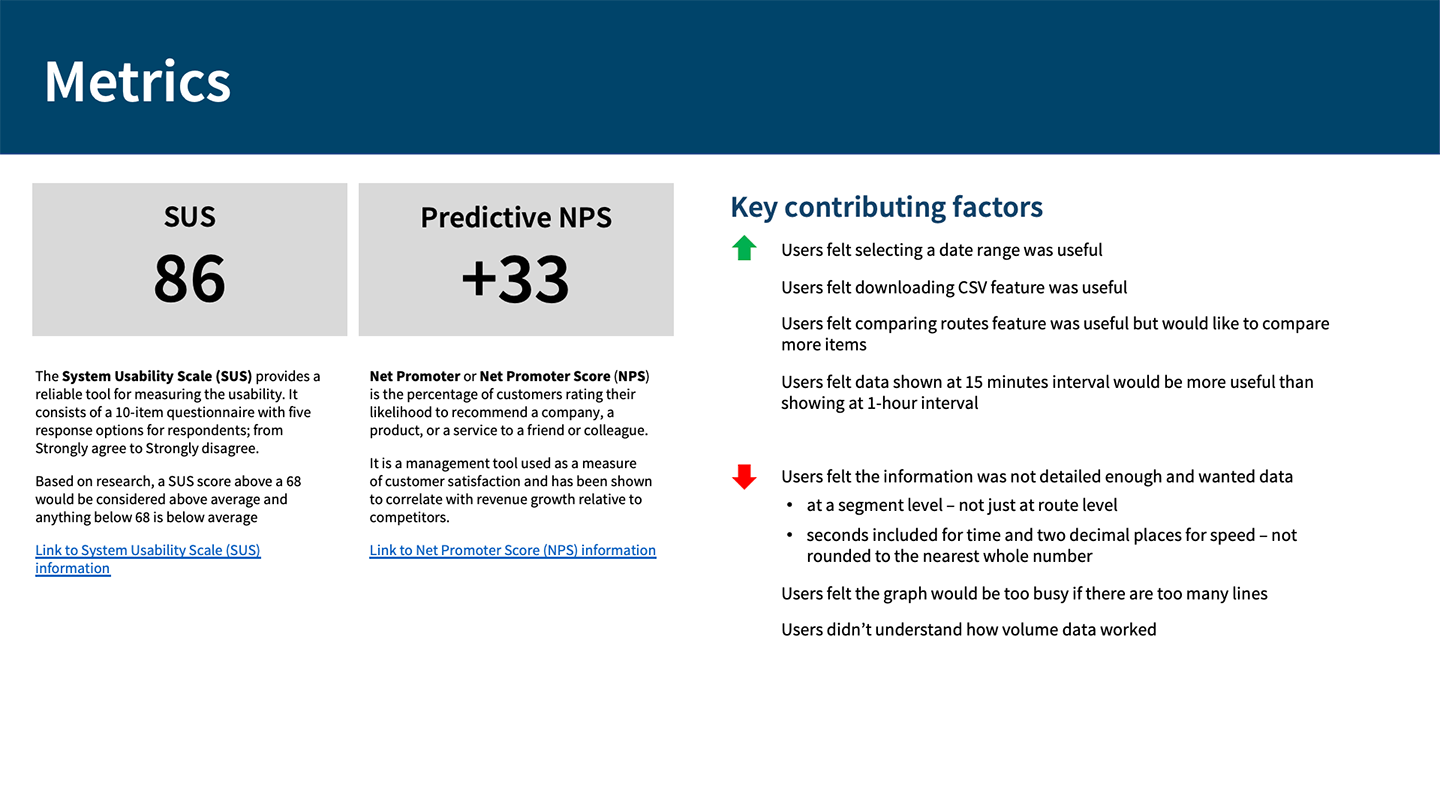
After facilitating the usability testing, I analysed, documented the results and presented them to the Traffic Watcher team. The documentation included an executive summary, key contributing factors, key insights, detailed walkthrough, system usability scale and predictive net promoter score.
The System Usability Scale (SUS) was 86, and the Predictive Net Promoter Score was +33.


Detailed design
After completing the usability testing task, I worked on the detailed design. I used findings from the usability testing to iterate and enhanced the design.

Creating tickets in JIRA
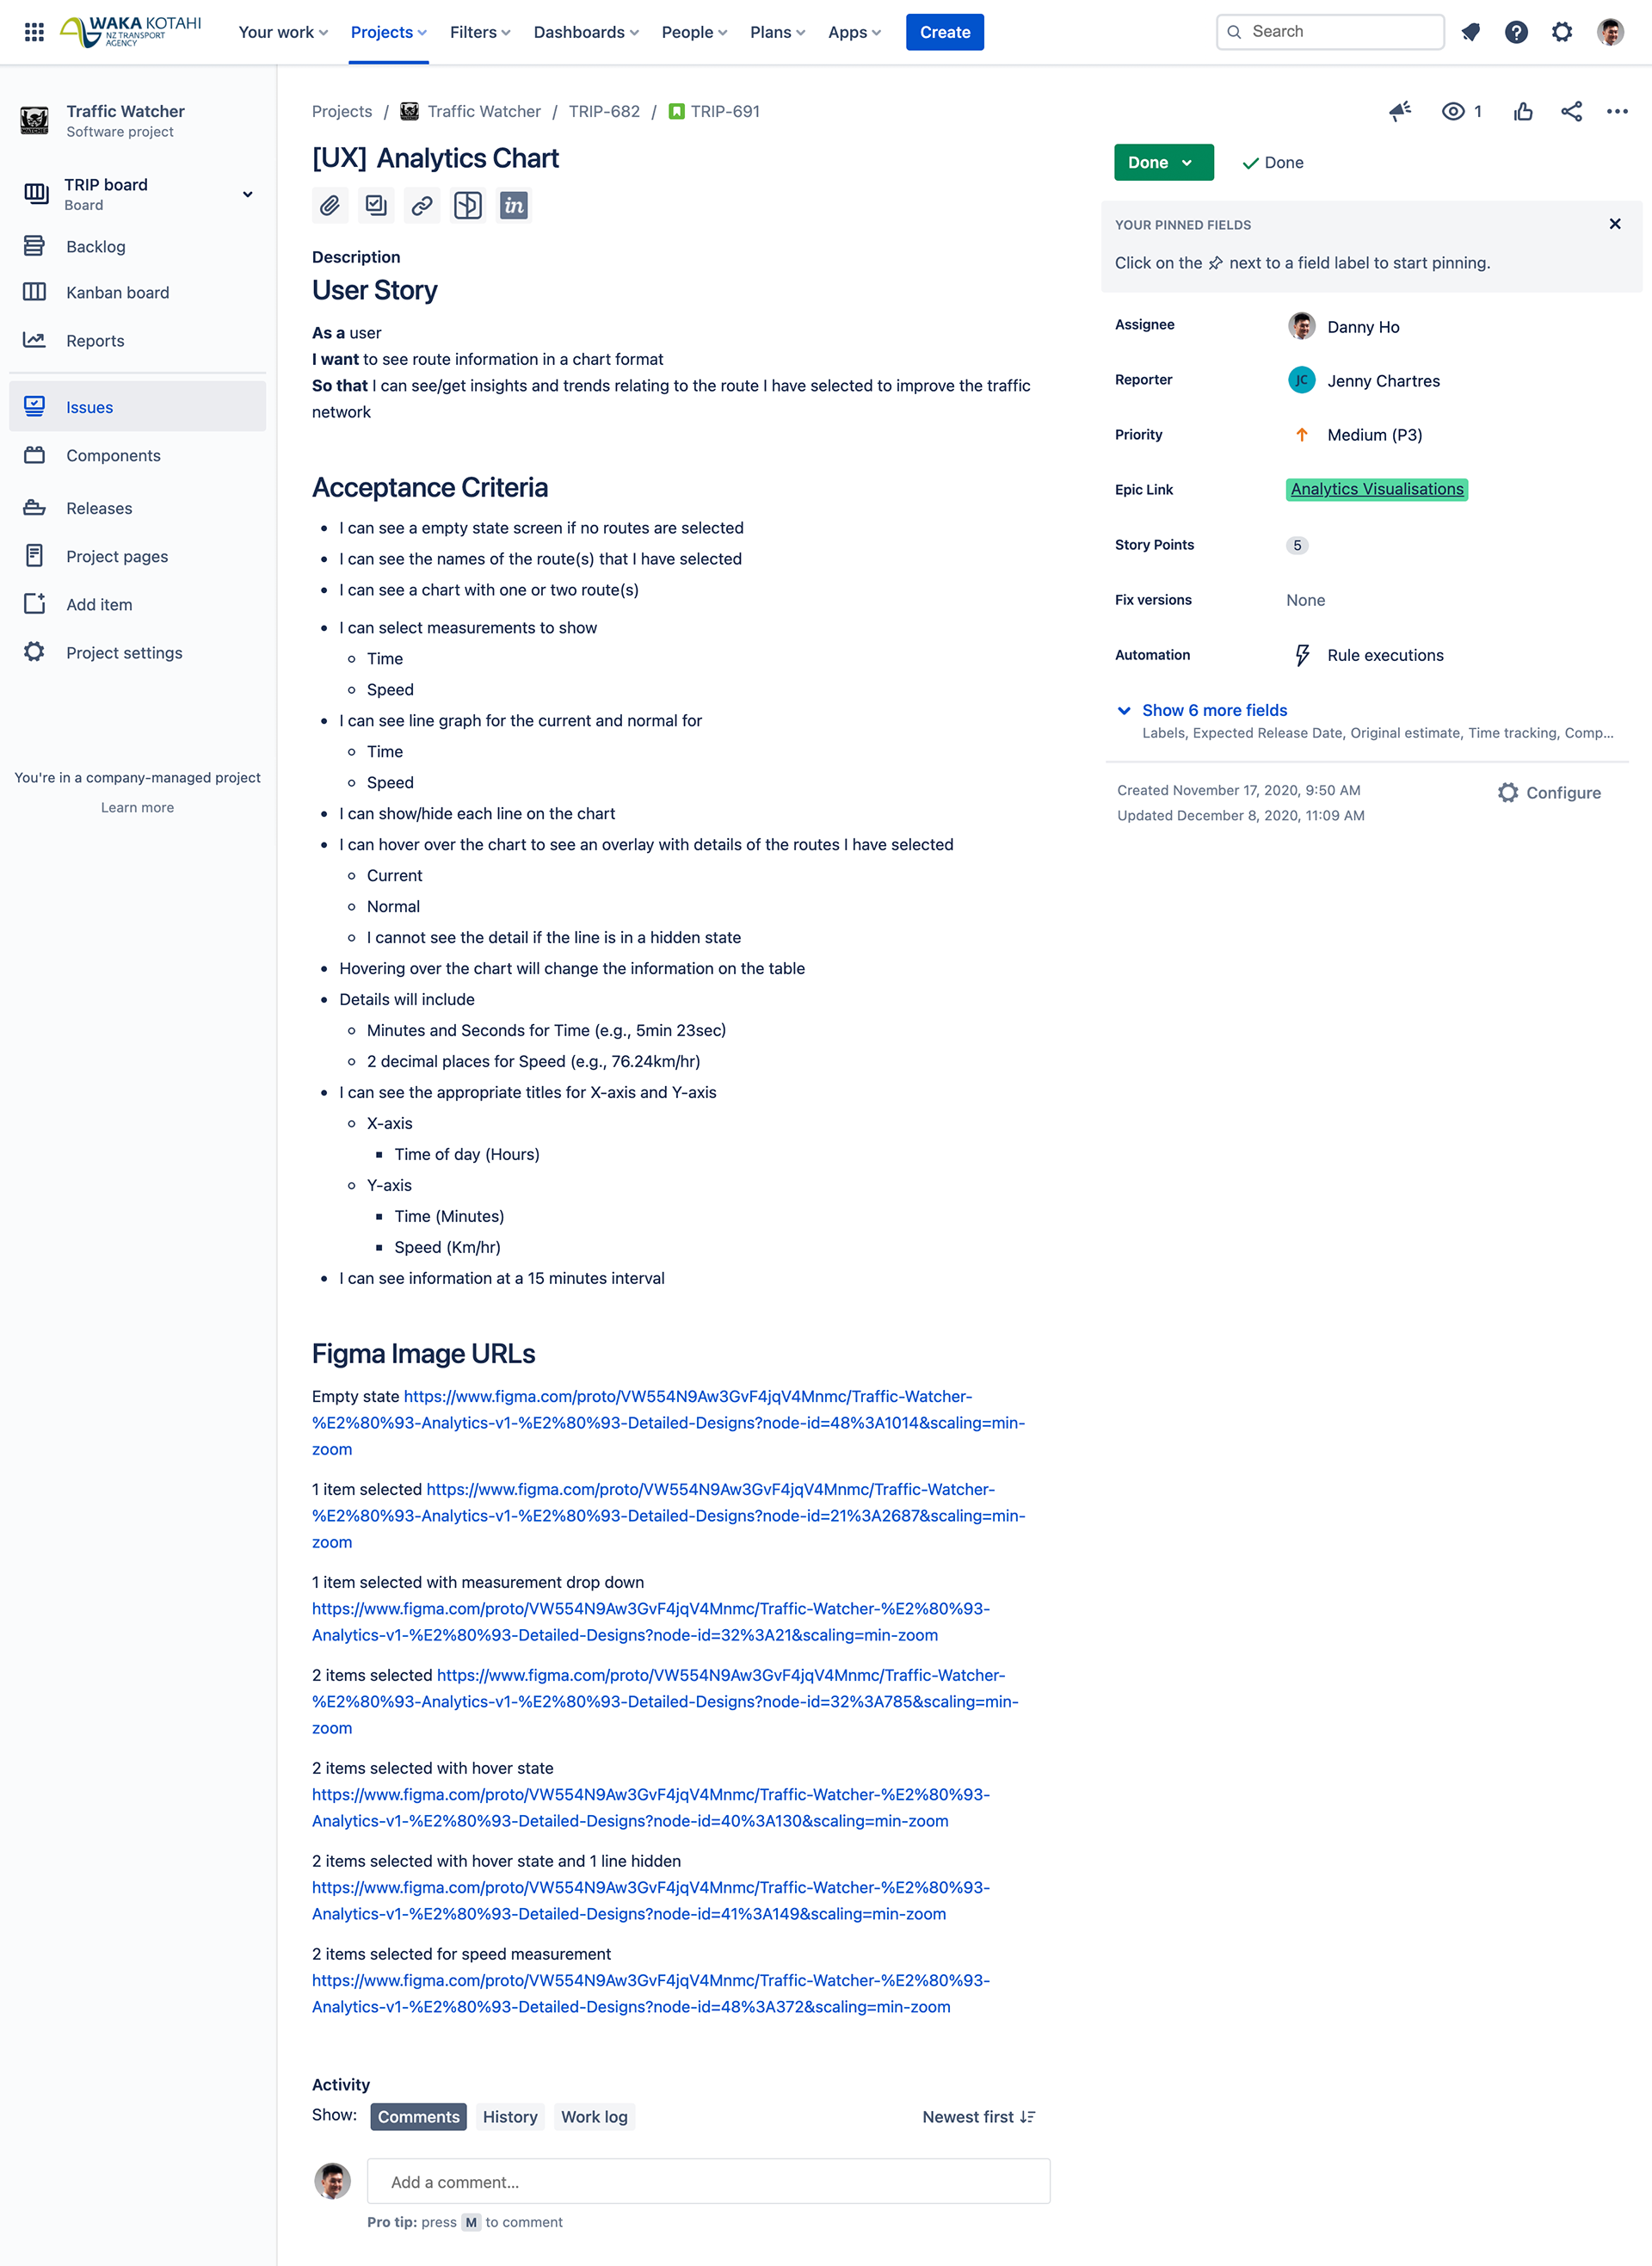
Once I completed the detailed designs, I broke them down into individual features and created tickets, wrote the user stories and requirements in JIRA for backlog refinement.
The Traffic Watcher team discussed, prioritised, and story pointed the individual features in the backlog refinement session.
Supporting developers
During sprint planning, JIRA tickets were added to the sprint, and I supported the Front-end developer and Quality assurance tester whenever they had queries about the designs.
Designing help and support materials
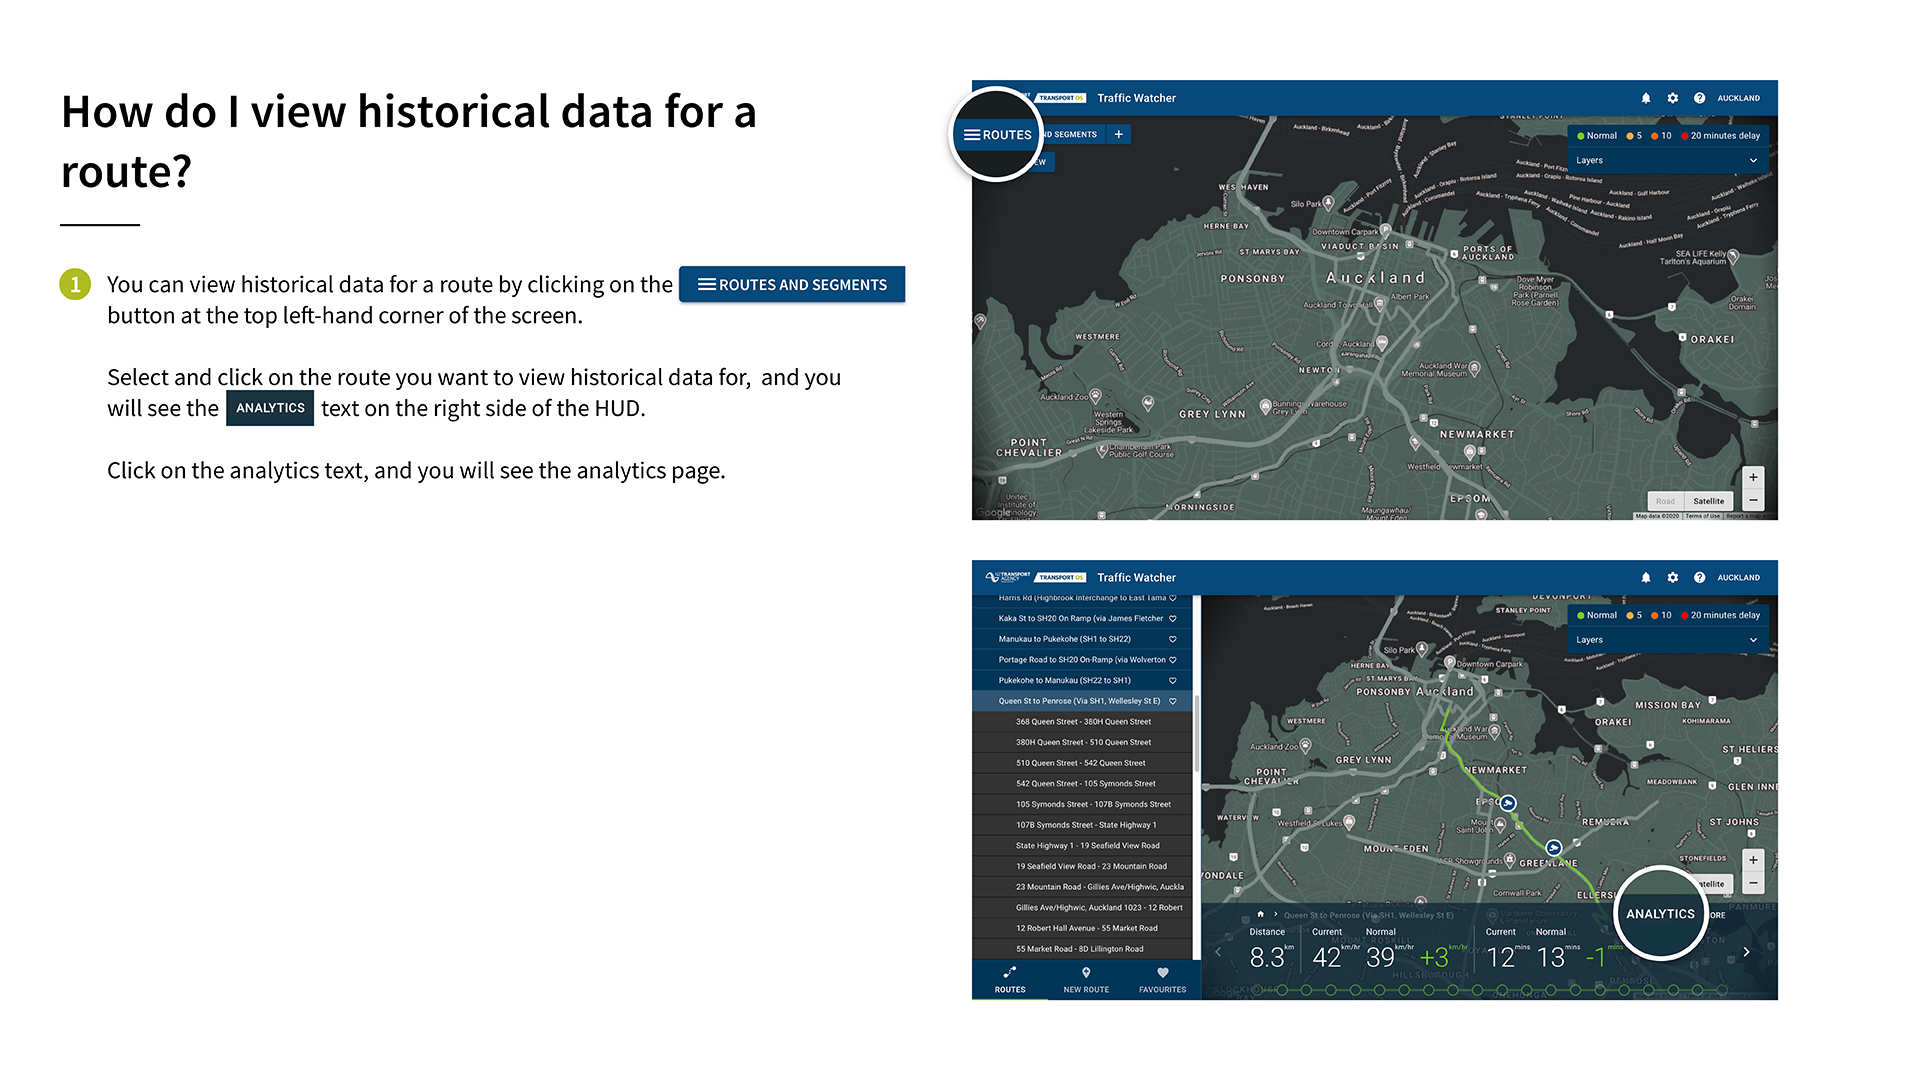
I designed a help guide for the analytics page to make the experience better for new users.


Waka Kotahi NZ Transport Agency – November 2020
Traffic Watcher Analytics
User experience and user interface design for desktop web application